Real Science
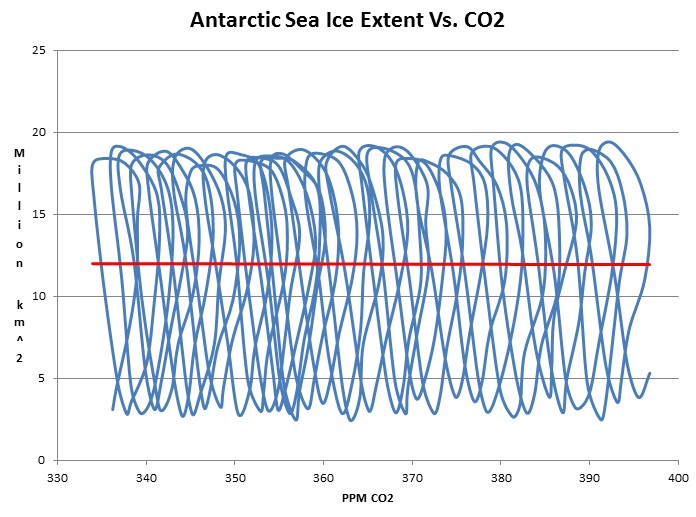
The graph below plots Antarctic sea ice extent vs. atmospheric CO2 on a month by month basis.
Never has the death spiral been so clear.


2 comments:
Hahaha, stupid graph. The ice builds when Antarctica is in winter and receives no sunlight. That's when it grows. It already goes down to essentially no sea ice in summer. No one expects there to be a "death spiral" there.
Hahaha, STUPID anonymous. Antarctic sea-ice has been setting records WINTER AND SUMMER.
JackAss.
Post a Comment